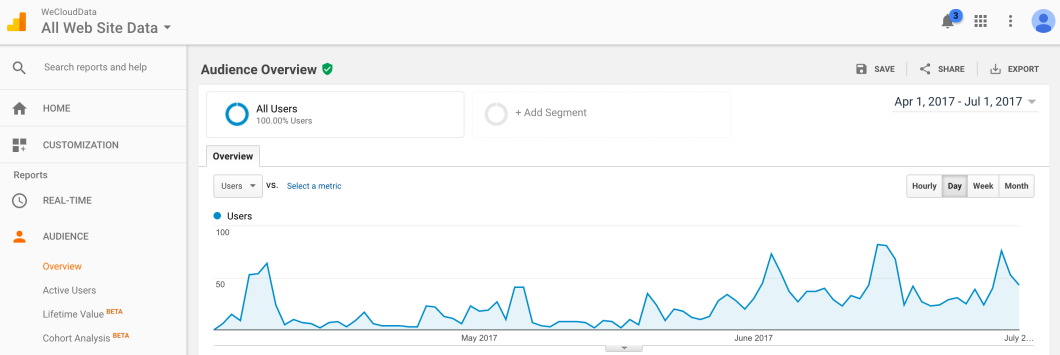
This is a second project that I have done in WeCloudData. The goal of this project is to find out likely user access in WeCloudData Web to help the company to raise its prestige.
We firstly collect data from Google API by using Python. We have grab date, user type, the day since the last session, source, users, new users, session duration, average session duration and organic searches as our variables.
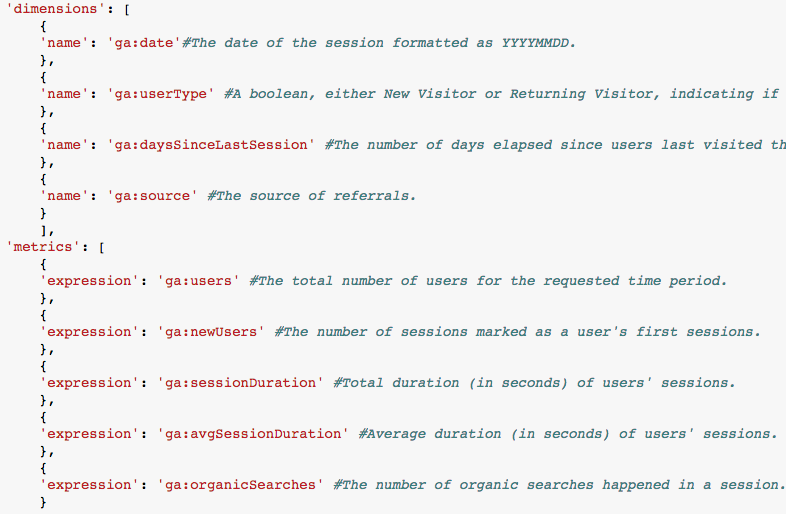
Then we construct the data frame as in below, which is first five rows of our data frame. After that, we have clean and summarize the data frame and find out the trend for users and new users click into WeCloudData Web from July 2016 to Oct. 2016 as well as the session duration.
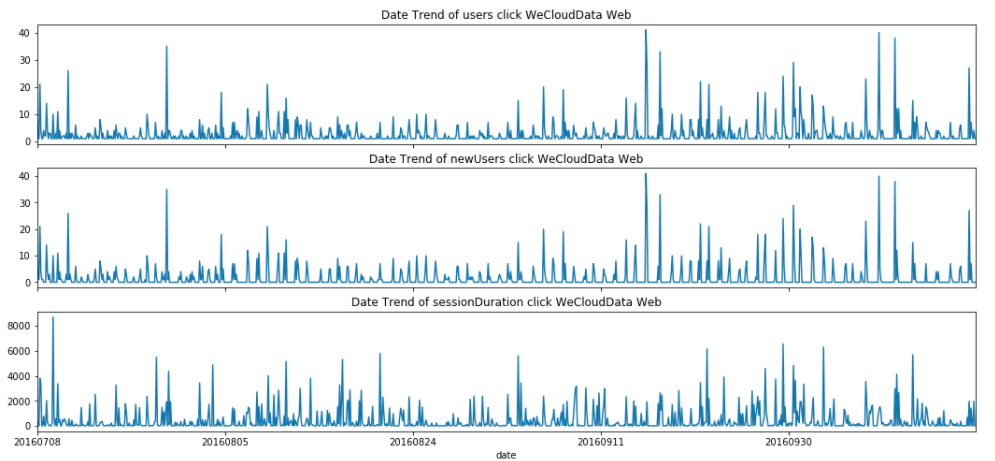
There are not much different between users and new users trends. On 2016 July, there might be some events in WeCloudData, users increasing as well as the session duration. There might have some events as well so that on mid of July the users rise sharply and the session duration rises as well. After that, the number of users becomes silence, but session duration is still very high, the reason might because during this time people who were watching WeCloudData spend more time than other times. Then from 2016 mid-Sep to the end, the number of users increase again as well as the duration time.
We have also drawn scatter plot of days since the last session:
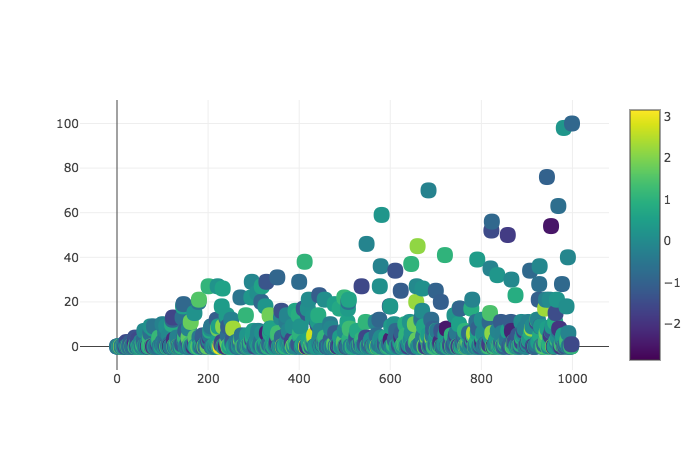
The x-axis is the label of users, and the y-axis is the number of days elapsed since users last visited the property. As you can see, there are some people attend back to the Web 100 days after.
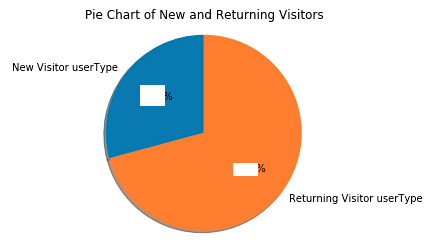
We have also drawn a pie chart for the new visitors and returning visitors. As you can see, the amount of returning visitors is far more than the new visitor. It is a good sign that people would like to return.
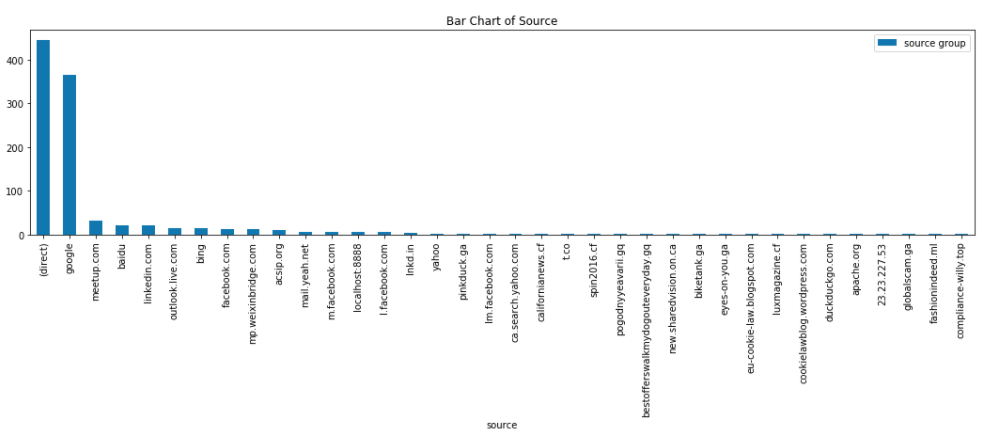
From Google API, we also have obtained the information how the reach WeCloudData Web. As you can see, most of them are directly search WeCloudData URL to reach the web. The second most one is from Google.
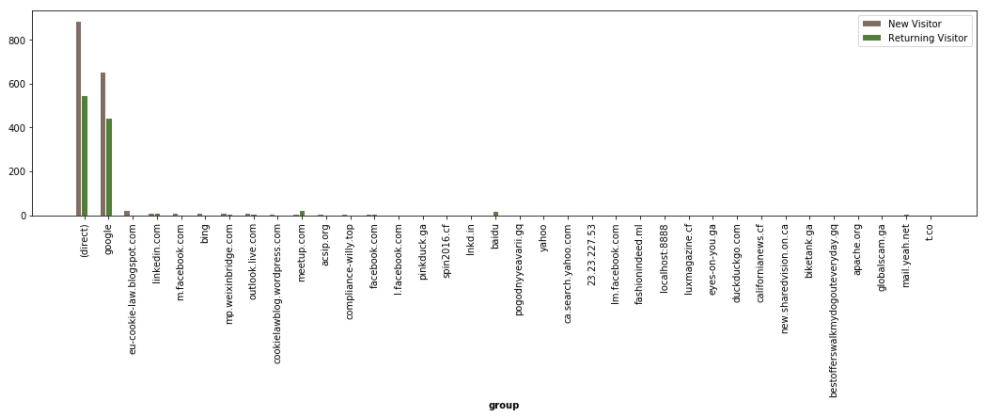
Then we compare the source in between new visitors and returning visitors. Most of new visitors directly search WeCloudData URL or google it.
In the end, we have done chi-squared test, to find out the relationship between the type of users and source.
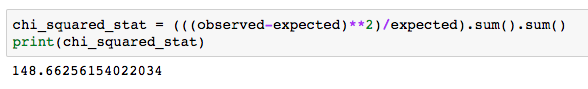
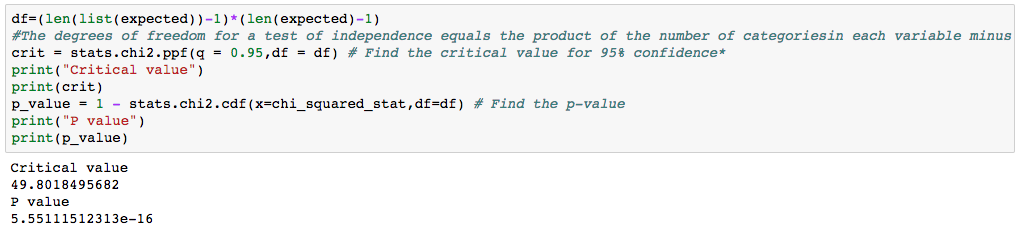
The output shows the chi-square statistic (148.66) and the p-value (5.55e-16) followed by the expected counts. As expected, given the high p-value, the test result detect a significant relationship between the source and type of users.
